In my previous school district, I was the only teacher teaching a physics course with set, district-wide learning outcomes. These same outcomes were also taught in physics classrooms at the other high school in our district. But at our school, I was one of the 2 physics teachers. The other teacher taught the AP-level physics courses. So, in many ways, I had opportunities to incorporate strategies I believed were best for learners and that I found worked best for them without being seen as out of alignment with anyone in our building. My amazing friend and one of my teaching philosophy goddesses, Katie Novak, stated the following misconception about alignment: All teachers must deliver instruction in the exact same way. True alignment, she says, is about shared goals, rigor, and outcomes. Thank you, Katie! Katie has taught me to truly believe that learner variability is the rule, not the exception. I encourage you to take 10 minutes to listen to Katie Novak explain it in the ...


Over the past year, I have been gradually working to implement the Next Generation Science Standards (NGSS) into my classroom. Our new Wisconsin State Science Standards were designed with the NGSS in mind. They align very well, so please forgive me if my language focuses on the NGSS in this post.
As I design lessons aligned the standards, I am considering to the skills students will be implementing that carry across multiple units. This relates to the Science and Engineering Practices contained in the standards. I am looking at the technology tools that can be used to leverage these practices. While there are 8 different practices and I hope to delve into each one and the technology tools that can help learners in each, this post will only focus on one practice. That practice is Developing and Using Models.
As the name indicates, there are two major components to this practice 1) developing models 2) using models. Before looking closer at each one, we need to look at how a model is defined. To quote Appendix F of the Next Generation Science Standards:
"Models include diagrams, physical replicas, mathematical representations, analogies, and computer simulations.
In science, models are used to represent a system (or parts of a system) under study, to aid in the development of questions and explanations, to generate data that can be used to make predictions, and to communicate ideas to others."
NGSS Lead States. (2013). Next Generation Science Standards: For States, By States (insert specific section title(s) being used if not referring to entirety of the NGSS). Retrieved from http://www.nextgenscience.org/
From anchor charts to modeling clay, there are many physical tools that could be used as well and could be equally valuable for learners. For the purposes of this post, I’m going to be focusing on tech tools that will assist with this process. While I may present some content specific example, the process of developing and using models is essential in every science discipline regardless of content.
Developing Models
The standards themselves look for students to develop models to accomplish several goals including:- Showing relationships between components or variables of a system
- Describing a phenomenon
- Showing inputs and outputs of a system
- Testing cause and effect relationships or predict outcomes
Diagrams
A great diagram will contain all the features students want to include and still be easily understood by others. The ability for students to arrange, manipulate, and iterate a digital diagram goes a long way to help in the modeling process. For me, I fall back on two tools students are very familiar with if they are in a Google for Education district. Those are Google Slides and Drawings.The power of diagrams is the ability for representation using visuals and text. Google Slides and Drawings allows users to easily add images, shapes, and lines to illustrate a process.


Google Jamboard is much more unstructured and free flowing. It is great for sketching out ideas. Your jams can be collaborative and will be stored to your Google Drive.
 |
| Using Jamboard to create a force diagram |
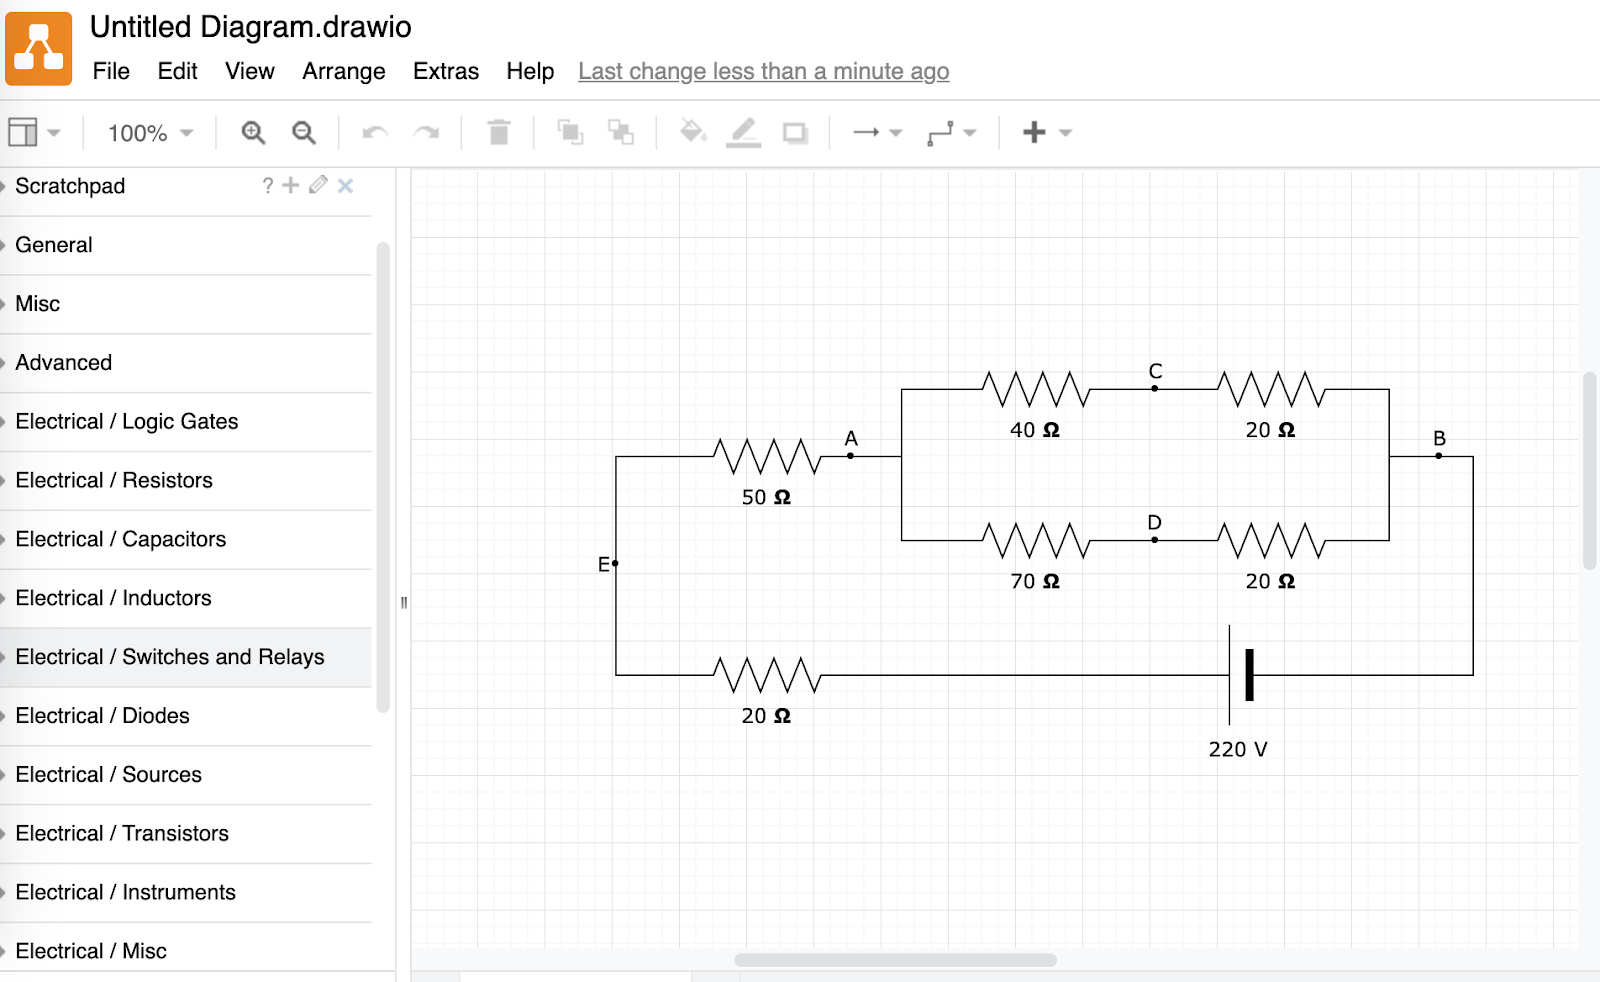
Draw.io diagrams is a Google App that has a bunch templates that can be used for diagram creation. Once the app is added, new diagrams can be created, edited, and shared directly from Google Drive.
As a physics teacher what I appreciate about it is the ability to create circuit diagrams easily.
The NGSS highlights evaluation and revision of models. Therefore, students should be able to easily share these models with others. The ability to set share settings in Google Drive files makes this possible. Students can get a sharable link or publish the file to the web. Just as important as sharing for feedback is the revision process. Physical diagrams can easily become messy as students revise models based on feedback or further investigation.
Again, the diagram is part of the process. It can be a tool to start the conversation as learners put together initial ideas for what they think is happening in a process. The diagram can help guide questioning and investigation as students attempt to define their model in greater detail. Being able to access and augment this diagram digitally allows for easy iteration as students attempt to incorporate new information into their model.
The complexity of a diagram may change through the course of a unit. In addition, the same process may be looked at in different grade levels. As students progress through their schooling, the tools used will need to allow learners to communicate more detail. The goals of the diagram should be to represent and communicate. A great diagram does not need to be overstuffed to do this.
 | |
|
 |
| Different Diagrams Modeling a Tennis Ball in Free Fall |
Physical Replicas
Many of us have made physical models in the past. The question is how well do they really model the process they represent. How accurately does that baking soda and vinegar volcano represent the geological processes it is meant to demonstrate?
In the age of 3D printing, students are able to design and create physical models. Tinkercad is a piece of digital design software that I have used with my students to create pieces to be laser cut or 3D printed. What is great about Tinkercad is that it works on Chromebooks. They have a series of great tutorials for students to walk through to start making 3D models to print.
To make their models dynamic, students should think in terms of the components that make it up. How are these pieces connect so that they can be manipulated. While it may be nice to have a static model of DNA double helix, a more sophisticated model would allow for unzipping the strand and pairing of complementary bases. Students can collaborate to each design the different components to be printed. All these separate pieces would then make up the final model. On Tinkercad, students can search for previously created models for guidance and iterate upon.
Even if they are not planning on 3D printing, these 3D digital models are pretty amazing tools to get a sense of what students are studying! Check out the Tinkercad models below:
Mathematical Representations
Graphs are a major model used in any science class. Beyond NGSS, any standardized science test will include analysis of graphs. The ability to represent a phenomenon or data set graphically is an essential science skill. The sophistication of graphs evolves as students progress through their schooling. But rather than using a new tool as the required depth increases, many of the same tools can be used.Getting back to Google apps, Google Sheets is a great tool for putting data into tables and using that data to create graphs. I am a high school teacher. So at my level, I take a lot of graphing basics for granted. Even though we use Google Sheets in class, the majority of students still need to teach the process of going from a set of number to a chart.
Google Sheets may seem like a lot to handle for elementary school students, but I feel that it could be scaffolded to be more accessible for young learners. I would love it if every student in my class had at some point made a graph in Google Sheets. That way we could build on students’ prior experiences to take the tool even further. Simpler tools are easier to implement at younger grades, but many of these elementary tools no longer have relevance after a certain grade level and students will be starting from scratch with a new tool. I love what Christine Pinto is doing with her littles and Google Sheets and Graphing. It can be done! Check her posts about it!
At lower grades, it is up to the teacher how much they want to scaffold, guide, and explain the process. The ability to create a template file for the students to work from can “hide” all of those steps required for chart creation steps until learners are ready to tackle them. That way all elementary learners may need to do is enter numbers and they get a chart. But, they are still doing it within Sheets so there is no requirement for a different tool. Teachers can introduce steps in time when the learner is ready. There are a lot of great conversations to be had in the creation of a graph from what type of graph should be used to what they titles of axes should be.
Google Sheets has the power to apply trend lines. But in my opinion, there are better apps available for applying statistical analysis to data sets. My favorite in the physics classroom in Vernier Graphical Analysis Chrome app. In a future post, I’ll be sure to discuss its data collection functionality. But, it allows for manual entry of data and automatic creation of scatter plots.
 | ||
Choose Manual Entry to Add Data Directly to a Table
|

 |
| Add Linear Fit to Data to Find Slope and Y-intercept |
 |
| Add Curve Fit to Quadratic Functions |
 |
| Plotting Position and Velocity Data vs Time in Desmos |
Computer Simulations
Creating digital simulations of phenomenon is a fairly advanced goal. I am not aware of many tools that would be accessible to many learners outside of a computer science course. The one tool that jumps to my mind and is great is Scratch. Using the block coding features in Scratch to create an interactive model with interactions and animation. But, it could a fairly complex project depending on the depth of the simulation.  |
| Student Built Interactive Water Simulation on Scratch |
Using Models
The second major aspect of this science practice is using and applying models. Any model students create using the above tools could be applied to a new situation to see how well it explains what is observed. The ability of the created model to explain a new situation will provide reason to accept the model or revise it.Diagrams
The quickest way to find visual representations of models is probably a Google Image Search. But a more targeted search can be done using Open Educational Resources Commons, OER. From OER, users can search for resources based on content area and type of material
You can then refine deeper by choosing specific standards, including NGSS.

Another great source for simulations is CK12. They have simulations for both physics and chemistry. They are searchable by topic. Each simulation is like a mini lesson that introduces learners to the situation, allows them to experiment and discover relationships between variables. Finally it poses a series of questions to the learner that guid exploration.
Another good source for simulations is The Concord Consortium. They have a wonderful NGSS activity finder that includes simulations. Teachers can build classes and assign these to their classes.

One more great source of simulations is GeoGebra. GeoGebra is a graphing calculator, but they have lots of simulations that can be searched for as well. Once a topic has been chosen, you can filter to just focus on activities.

The simulations provide opportunities for learners to address many components of this science practice including:
Alright, what digital tools are you using in class to help students model processes that they observe or are studying? I would love to add them to this post!
I look forward to moving on to a different science practice next time and highlighting digital tools that relate to it.

Simulations
In terms of using digital models, I feel that simulations are an excellent tool to help students change variables and see results, see processes that are invisible to the eye, or on large scales of time and space. Of all the places to find science simulations, PhET interactive simulations for math and science is by far my favorite. Their simulations cover all areas of science and are applicable across all grade levels. The fact that they have been converting many of their their simulations to HTML5 is wonderful for classrooms using Chromebooks and tablets.Another great source for simulations is CK12. They have simulations for both physics and chemistry. They are searchable by topic. Each simulation is like a mini lesson that introduces learners to the situation, allows them to experiment and discover relationships between variables. Finally it poses a series of questions to the learner that guid exploration.
Another good source for simulations is The Concord Consortium. They have a wonderful NGSS activity finder that includes simulations. Teachers can build classes and assign these to their classes.

One more great source of simulations is GeoGebra. GeoGebra is a graphing calculator, but they have lots of simulations that can be searched for as well. Once a topic has been chosen, you can filter to just focus on activities.

The simulations provide opportunities for learners to address many components of this science practice including:
- Discovering the components of a system
- Generate data
- Evaluate limitations of a model
- Test cause and effect relationships
- Identify limitations of a model
Alright, what digital tools are you using in class to help students model processes that they observe or are studying? I would love to add them to this post!
I look forward to moving on to a different science practice next time and highlighting digital tools that relate to it.
Comments
Post a Comment